California home sales report data show slower activity across the state during the week ending Sept. 5, with closed sales, pending sales and new listings all declining from the previous week.
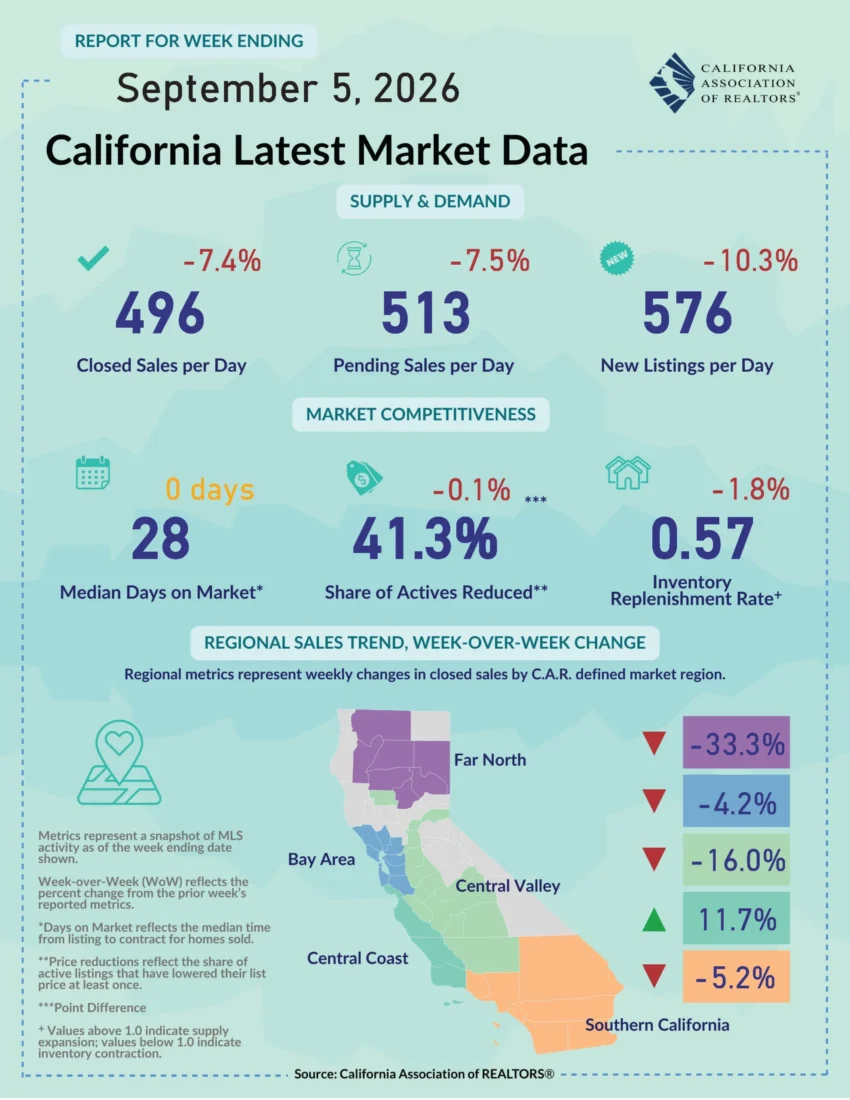
Closed sales averaged 496 per day, down 7.4%, according to the California Association of REALTORS®. Pending sales averaged 513 per day, a 7.5% decline, while new listings fell 10.3% to 576 per day.
The weekly figures offer San Gabriel Valley homeowners and prospective buyers a snapshot of broader conditions across California. The report does not provide city- or county-level figures. It therefore does not show whether El Monte, Baldwin Park or other local communities followed the statewide trend.
C.A.R. describes the figures as a snapshot of Multiple Listing Service activity as of the week ending date. Week-over-week figures measure changes from the prior week’s reported metrics. Readers can find more statewide housing statistics through the California Association of REALTORS® market data resources. (California Association of Realtors)
Regional Differences
Sales trends varied widely across California’s regions.
Southern California recorded a 5.2% week-over-week decrease in closed sales. That decline was smaller than those recorded in several other parts of the state.
Closed sales dropped 33.3% in the Far North and 16% in the Central Valley. The Bay Area posted a 4.2% decrease.
The Central Coast moved in the opposite direction, recording an 11.7% increase in closed sales from the previous week. It was the only region shown in the report with a weekly gain.
The figures measure changes in closed sales within regions defined by C.A.R. They do not provide sales totals for each region.
Listings Spend 28 Days On Market
The statewide median market time remained at 28 days, unchanged from the previous week.
C.A.R. defines the measure as the median time from when a home is listed until it goes under contract.
Price reductions remained common. The share of active listings with at least one price reduction stood at 41.3%, down 0.1 percentage point from the previous week. C.A.R. defines the measure as active listings that have lowered their list price at least once.
The inventory replenishment rate stood at 0.57, a 1.8% decline. According to the report, values above 1 indicate expanding supply, while values below 1 indicate inventory contraction.
Taken together, the weekly figures show slower sales activity alongside fewer new listings and contracting inventory. The report does not establish whether those conditions will continue in coming weeks.
For San Gabriel Valley buyers and sellers, the statewide and Southern California figures provide broader market context rather than a direct measure of neighborhood conditions. Local prices, inventory and sales activity can vary by city and community.